Sunday 29 August 2021

What Are Liabilities in Accounting?


Pie charts and calculator floating on red background

What Are Liabilities in Accounting? (With Examples)

No one likes debt, but it’s an unavoidable part of running a small business. Accountants call the debts you record in your books “liabilities,” and knowing how to find and record them is an important part of bookkeeping and accounting.

Here’s everything you need to know about liabilities.

What are liabilities in accounting?

Liabilities are any debts your company has, whether it’s bank loans, mortgages, unpaid bills, IOUs, or any other sum of money that you owe someone else.

If you’ve promised to pay someone a sum of money in the future and haven’t paid them yet, that’s a liability.

How to find liabilities

You can find all of your liabilities on your company’s balance sheet, which is one of the three major financial statements. (The other two being the income statement and the cash flow statement.)

All balance sheets are divided into three sections:

  1. The assets section, which tells you how much you have.

  2. The equity section, which tells you how much you and other investors have invested in your business so far.

  3. The liabilities section, which tells you what you owe.

Balance sheets used to be written out in two columns: the left column would be reserved for assets, while the right column was always reserved for liabilities and equity.

Here’s a balance sheet for a hypothetical business, Annie’s Pottery Palance, written out in this two-column format:

annies-pottery-balance-sheet

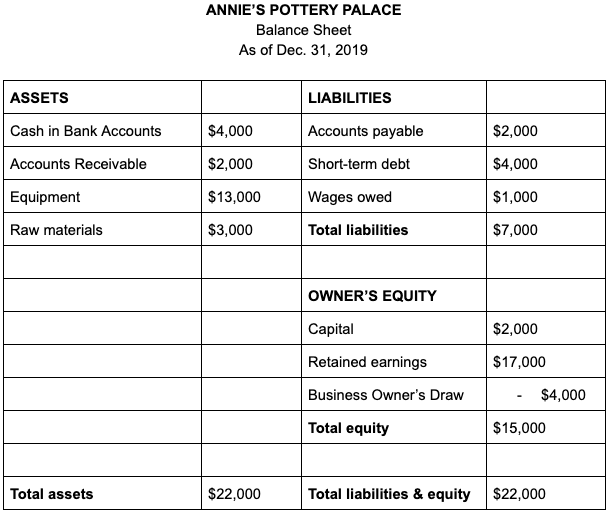
See how Annie’s total assets equal the sum of her liabilities and equity? That’s not just a fluke. If your books are up to date, your assets should also equal the sum of your liabilities and equity.

Accountants call this relationship the accounting equation, which is the most important equation in all of accounting. You can write it out in equation form like so:

Assets = Liabilities + Equity

If your assets don’t equal your liabilities and equity, the two sides of your balance sheet won’t ‘balance,’ the accounting equation won’t work, and it probably means you’ve made a mistake somewhere in your accounting.

These days, the two-column balance sheet format is less popular. Your accounting software might spit out your balance sheet in a single-column, like so:

annas-pottery-balance-sheet

The important thing here is that if your numbers are all up to date, all of your liabilities should be listed neatly under your balance sheet’s “liabilities” section.

Further reading: What Are Assets, Liabilities, and Equity?

Get crystal clear financial statements every month.

Powerful financial reporting comes standard with Bench. Track every business transaction and performance metric like a pro, and run a smarter business right away.

Learn More

Examples of liabilities

Most businesses will organize the liabilities on their balance sheet under two separate headings: current liabilities and long-term liabilities.

Current liabilities are debts that you have to pay back within the next 12 months.

Long-term liabilities are debts that aren’t due for more than 12 months.

We separate these for two reasons:

  1. It makes it easier for anyone looking at your financial statements to figure out how liquid your business is (i.e. capable of paying its debts).

  2. Generally accepted accounting principles (GAAP) require you to do so.

Current liabilities

These are any outstanding bill payments, payables, taxes, unearned revenue, short-term loans or any other kind of short-term financial obligation that your business must pay back within the next 12 months.

Some common examples of current liabilities include:

  • Accounts payable, i.e. payments you owe your suppliers
  • Principal and interest on a bank loan that is due within the next year
  • Salaries and wages payable in the next year
  • Notes payable that are due within one year
  • Income taxes payable
  • Mortgages payable
  • Payroll taxes

Long-term liabilities

Also sometimes called “non-current liabilities,” these are any obligations, payables, loans and any other liabilities that are due more than 12 months from now.

Some common examples of long-term liabilities include:

  • Principal and interest payments due more than a year from now
  • Bonds, debentures and long-term loans
  • Deferred tax liabilities
  • Lease payments that aren’t due for more than a year
  • Pension obligations
  • Mortgage, equipment and other capital payments that aren’t due for more than a year

What about contingent liabilities?

Some businesses might record a third type of liability on their balance sheets: contingent liabilities. These are any liabilities you might owe someone, depending on the result of a lawsuit or if you have to pay your customers back to satisfy the terms of a warranty, for example.

Get crystal clear financial statements every month.

Powerful financial reporting comes standard with Bench. Track every business transaction and performance metric like a pro, and run a smarter business right away.

Learn More

How to calculate liabilities

Because most accounting these days is handled by software that automatically generates financial statements, rather than pen and paper, calculating your business’ liabilities is fairly straightforward. As long as you haven’t made any mistakes in your bookkeeping, your liabilities should all be waiting for you on your balance sheet. If you’re doing it manually, you’ll just add up every liability in your general ledger and total it on your balance sheet.

But there are other calculations that involve liabilities that you might perform—to analyze them and make sure your cash isn’t constantly tied up in paying off your debts. We call this credit accounting.

Here are some common calculations that accountants use in credit accounting, and why they’re important:

The debt ratio

By far the most important equation in credit accounting is the debt ratio. It compares your total liabilities to your total assets to tell you how leveraged—or, how burdened by debt—your business is.

The debt ratio equation is:

Debt ratio = Total liabilities / Total assets

So the debt ratio for Annie’s Pottery Palace (from the balance sheet example above) would be:

Debt ratio = $7,000 / $22,000 = 31.8%

Generally speaking, the lower the debt ratio for your business, the less leveraged it is and the more capable it is of paying off its debts. The higher it is, the more leveraged it is, and the more liability risk it has.

Although average debt ratios vary widely by industry, if you have a debt ratio of 40% or lower, you’re probably in the clear. If you have a debt ratio of 60% or higher, investors and lenders might see that as a sign that your business has too much debt.

The long-term debt ratio

This ratio is similar to the debt ratio, except for one difference: it leaves current liabilities out of the equation.

The long-term debt ratio equation is:

Long-term debt ratio = Long-term liabilities / Total assets

So a company with $4,000 in long-term liabilities and $20,000 in total assets would have a long-term debt ratio of:

Long-term debt ratio = $4,000 / $20,000

Long-term debt ratio = 20%

We use the long term debt ratio to figure out how much of your business is financed by long-term liabilities. Generally speaking, you want this number to go down over time. If it goes up, that might mean your business is relying more and more on debts to grow.

The debt to capital ratio

Another popular calculation that potential investors or lenders might perform while figuring out the health of your business is the debt to capital ratio.

The equation for the debt to capital ratio is:

Debt to capital ratio = Total liabilities / Total liabilities + Total equity

That means that the debt to capital ratio for Annie’s Pottery Palace would be:

Debt to capital ratio = $7,000 / $7,000 + $15,000

Debt to capital ratio = $7,000 / $22,000

Debt to capital ratio = 31.8%

In most cases, lenders and investors will use this ratio to compare your company to another company. A lower debt to capital ratio usually means that a company is a safer investment, whereas a higher ratio means it’s a riskier bet.

Get crystal clear financial statements every month.

Powerful financial reporting comes standard with Bench. Track every business transaction and performance metric like a pro, and run a smarter business right away.

Learn More

What's Bench?

We're an online bookkeeping service powered by real humans. Bench gives you a dedicated bookkeeper supported by a team of knowledgeable small business experts. We’re here to take the guesswork out of running your own business—for good. Your bookkeeping team imports bank statements, categorizes transactions, and prepares financial statements every month. Get started with a free month of bookkeeping.


This post is to be used for informational purposes only and does not constitute legal, business, or tax advice. Each person should consult his or her own attorney, business advisor, or tax advisor with respect to matters referenced in this post. Bench assumes no liability for actions taken in reliance upon the information contained herein.

Friends don’t let friends do their own bookkeeping. Share this article.

YOU MAY ALSO LIKE
Cash Basis Accounting vs. Accrual Accounting

The main difference between cash basis and accrual accounting is the timing of when revenue and expenses are recognized. Which is right for your business?

Learn more
General Ledgers: A Complete Guide

The general ledger is your “source of truth” in bookkeeping. Here’s a simple explanation of what it is, and how to use it in your business.

Learn more
Understanding Income Statements vs Balance Sheets

Knowing the difference between income statements and balance sheets, and the information they hold, is critical to your success in business.

Learn more

Want a free month of bookkeeping?

Sign up for a trial of Bench. We’ll do one month of your bookkeeping and prepare a set of financial statements for you to keep. No pressure, no credit card required.

Decorative patterns

No comments:

Post a Comment

Top

Top
Billionaires

Vehicle

Vehicle
Cost analysis

Tim Hortons Coffee

Tim Hortons Coffee
One dollar every Single day

RESULTS , RESULTS , RESULTS

RESULTS , RESULTS , RESULTS
Goal #1 -- $ 1 000 000 000 USD

How do Others do ?

How do Others do ?
At Least 10 hours every weekday

PHASE 07--SEVEN

PHASE 07--SEVEN
BUSINESS INVESTMENTS. SME PROJECTS ( ONE DOLLAR EVERY MINUTE )

PHASE 06--SIX

PHASE 06--SIX
HOME OWNERSHIP AFFORDABILITY. ( ONE DOLLAR EVERY 15 MINUTES )

PHASE 05 -- FIVE

PHASE 05 --  FIVE
CAR RENTAL. ONE DOLLAR EVERY HOUR. ($ 24 A DAY )

Phase 04 -- Four

Phase 04 -- Four
A Cup of Coffee every Morning ( One dollar every day)

Phase 03 -- Three

Phase 03 -- Three
Bank fees. 1.00 $ every Week

Phase 2 -- Two

Phase 2 -- Two
One dollar Monthly Magazine Subscription. ( One dollar every Month )

Phase 01-ONE

Phase 01-ONE
Coins Collection Memorabilia. ( One dollar every year )

Coins Collection Memorabilia Keepsakes

Coins Collection Memorabilia Keepsakes
Phase 01 -- One Dollar Every year

Minimum Savings Rate

Minimum Savings Rate
Time and Money

Seven Phases ( 1.00 $ Rates )

Seven Phases ( 1.00 $ Rates )
MINIMUM !!!!

2000 Ways of NOT Making Money

2000 Ways of NOT Making Money
Idea City

Jeff ...The Amazonian

Jeff...The Amazonian Jeff has Wealth Worth More than 100 Billion dollars. 🔥$ 100 000 000 000 USD 🌶️ And the Ordinary Mwananchi has just a 100 dollars. 🍅 $100 USD🍉

Toonies

Toonies
$2.00. Rolls

A dollar every hour

📌📌📌📌📌📌📌📌📌📌 A dollar every hour ( $$$$$) Daily === 24 dollars Weekly === 24 X 7 == 168 dollars Monthly === 24 X 30 = 720 dollars Yearly ==== 24 X 365.25 == 8 766 dollars 100 Years ===== 876600 $ 📌📌📌📌📌📌📌📌

Leasing a Vehicle

Leasing a Vehicle
At 146 $ / Week

Five Phases Now 🌶️🌶️

Five Phases Now 🌶️🌶️
Money and Time

Car Rental

Car Rental
Pay as you go

Home Ownership affordability

Home Ownership affordability
About $ 3000 Every Month

Minimum Savings Rates

Minimum Savings Rates PHASE 01: One dollar Every year. 100 $ in 100 years. PHASE 02: One dollar Every Month 1200 $ in 100 years. PHASE 03: One dollar Every Week. 5200 $ in 100 years. PHASE 04: One dollar Every day. 36500 $ in 100 years.

PAY

KES , YEN and USD

🍉🍉🍉🍉🍉🍉🍉🍉🍉 1 Kenyan Shilling equals 1.01 Japanese Yen. 🍉🍉🍉🍉🍉🍉🍉🍉🍉 1 United States Dollar equals 109.79 Japanese Yen 🍉🍉🍉🍉🍉🍉🍉

Annual income

Annual income 5 Figure Annual income From 10 000 $ to 90 000 $ 📌📌📌📌 6 Figure Annual income From 100 000. to 900 000 $ 📌📌📌📌 7 Figure Annual income From 1 000 000 to 9 000 000 $ 📌📌📌📌

10 highest paying countries for doctors:

Statistics Bar chartChart with upwards trend @stats_feed · 8h 10 highest paying countries for doctors: Luxembourg Flag of Luxembourg $352,300 USA Flag of United States $350,300 Belgium Flag of Belgium $331,200 Canada Flag of Canada $249,000 Switzerland Flag of Switzerland $228,000 Germany Flag of Germany $222,700 Austria Flag of Austria $213,200 Australia Flag of Australia $210,800 Ireland Flag of Ireland $209,000 Netherlands Flag of Netherlands $200,300

FUNDS in 100YEARS

FUNDS in 100YEARS
TIME and MONEY

Canadian

Canadian
Fine Gold

FUNDS CATEGORIES

FUNDS CATEGORIES AUTO &TRANSPORT BILLS and UTILITIES BUSINESS SERVICES EDUCATION ENTERTAINMENT FEES & CHARGES FINANCIAL FOOD & DINING GIFTS & DONATIONS HEALTH & FITNESS HOME INCOME INVESTMENT KIDS PERONAL CARE PETS SHOPPING TAXES TRANSFER TRAVEL UNCATEGORIZED

Brand New Vehicle

Brand New Vehicle
Average Price 30K to 60K

FUNDS CATEGORIES

FUNDS CATEGORIES
DISTRIBUTION

Ad

Ad
Hg

Kj

Kj
Xg

Ls

Ls
Xi

liabilities

a thing for which someone is responsible, especially a debt or financial obligation. plural noun: liabilities

Administration

Administration

#########
___________

Administration.... Wasting Money and Time

###########
_____________
Business hours....Rate from 14$ to 400$ / hour

Popular Reasons for Saving

Popular Reasons for Saving
##########
________________
-----------------+
Retirement
-----------------
#########
_____________
Education
---------------
#########
___________

Wedding
---------------
##############
_____________

A New Home
----------------+
############
____________

A New Vehicle...eg Audi Quattro
--------------------
################
______________

Dream Vacation...eg Hajj
-----------------
##############
________________

Emergency Funds
-------------------
#################
____________

Growing Savings.. TIME and MONEY
-------------------
###############
______________


Goals

Goals
____________
##########

6 hours @ 20$ /hour
__________
#########$

====== $ 120 CAD
__________
########

___________

Average

Average
Homes in Canada

Live off Dividends

Live off Dividends
Side orders

Weekly Food

Weekly Food
###########
------------
Water
###########
----------
Fresh Milk
##########
-----------
Bread +Cesh Pita
###########
-----------
Eggs
###########
-----------
Fruits
#########
---------
Vegetables
###########
-----------
Sub Total of $20.00
###########
------------
Extra Stuff another $ 20.00
############
------------
Taxes plus Miscellaneous..$10:00
##############
----------
Total Weekly Food $50.00 CAD
######
----------

average incomes

average incomes
regional

Loonies

Loonies
$ 1

The 10 Cheapest Cars You Can Buy In 2021 ( USD)

The 10 Cheapest Cars You Can Buy In 2021. (USD)
#######
------------
2021 Hyundai Elantra | $20,645
######
------------
2021 Nissan Sentra | $20,335
######
-----------
2021 Volkswagen Jetta | $ 19,990
#######
------------
2021 Subaru Impreza | $19,720
#######
------------
2021 Kia Forte | $18,855
#######
------------
2021 Kia Rio | $17,015
######
-----------
2021 Hyundai Accent | $16,390
########
------------
2021 Nissan Versa | $15,855
########
---------
2021 Mitsubishi Mirage | $15,565
########
----------
2021 Chevrolet Spark | $14,395
#######
-------++

Truck to Africa

Truck to Africa
Project Africa

Canadian Provinces Average House Prices April 2020

Canadian Provinces Average House Prices April 2020
-------------
Province Average House Price 12 Month Change
-------------
British Columbia $736,000 + 7.6 %
-------------
Ontario $594,000 – 3.2 %
------------
Alberta $353,000 – 7.5 %
--------------
Quebec $340,000 + 7.6 %
----------------
Manitoba $295,000 – 1.4 %
----------------
Saskatchewan $271,000 – 3.8 %
----------------
Nova Scotia $266,000 + 3.5 %
-----------------
Prince Edward Island $243,000 + 3.0 %
-----------------
Newfoundland / Labrador $236,000 – 1.6 %
------------------
New Brunswick $183,000 – 2.2 %
------------------
Canadian Average $488,000 – 1.3 %

---------------

Prices from The Canadian Real Estate Association

PROJECT AFRICA

PROJECT AFRICA
_________________
------------------------
Africa
#######
Shipping a Truck or any Vehicle
#########
To Africa.

Monthly internet cost

Monthly internet cost
GTA Ontario

Vehicle

Vehicle
Auto

Distribution of Funds

Distribution of Funds

Directors' Budget.... $ 4 000 000 CAD

Managers' Budget .... $ 400 000 CAD

Drivers' Budget .... $ $ 40 000 CAD

Officers' Budget .... $ 4000 CAD

Million dollar home

Million dollar home
Bangalow

Credit Score

Credit Score
How Companies determine

Receive

Receive
Dividend

8 Income Streams

8 Income Streams
Business

Room Rates

Room Rates
The Hotel

Dollars..in a bottle

Dollars..in a bottle

25¢

25¢
Canadian.2

Gold

Gold
The Yellow Heavy Metal

How much did you make this Year ???

How much did you make this Year ???

_____________________________________

How much did you make this Year ???

______________________________

How much did you make this Year ???

______________________

How much did you make this Year ???

Comparison of Net Worth

Comparison of Net Worth

Net worth

Your net worth is calculated by subtracting your liabilities from your assets.

Essentially, your assets are everything you own, and your liabilities are everything you owe

Person 7676
Net Worth
$ 4 Billion dollars....Year 2021
Only 4 Million dollars....Year 2011

Person 2244
Net Worth
$ 400 000 dollars... Year 2021
Only 4000 dollars....Year 2011

Person 6848
Net Worth
$ 4000 dollars.... Year 2021
Only 400 dollars ....Year 2011

Person. 5454
Net Worth
$ 400 dollars ....Year 2021
Only 40 dollars .... Year 2011

Year 2021
$ 4 000 000 000....P7676
$ 400 000 .... P2244
$ 4000 .... P6848
$ 400 .... P5454

25¢

25¢
Canadian

Cryptocurrency

Cryptocurrency
Digital

Quarter coin

Quarter coin
US

Coins..$2

Coins..$2
Rolls and boxes

Transcation Method

Transcation  Method
Banking

Coins..1$

Coins..1$
Rolls and boxes

Coins

Coins
Rolls and boxes

Coins

Coins
Rolls and boxes

Money tags

Rent , Food bill, Gas Fuel, Transportation

Fluids water , Basic Essential Needs , phone bill

Internet Tech. Bill , employment income

Tax return , Business Profit , Clubs Resources

G

G
P

Transaction Type

Transaction Type
Banking

V

V
S

MINIMUM SAVINGS:

MINIMUM SAVINGS:


DECADE 01-- $ 3652.50


DECADE 02 -- $ 7305.00


DECADE 03 -- $ 10957.50


DECADE 04 -- $ 14610.00


DECADE 05 -- $ 18262.00


DECADE 06 -- $ 21915.00


Ever increasing GAP between the Super RICH and the Rest of US.

Ever increasing GAP between the Super RICH and the Rest of US.
Over $ 100 Billion dollars

D

D
F

POWER LEVELS

POWER  LEVELS
WEALTH

B

B
T

Who Earns What ?

Who Earns What ?
Toronto

Z

Z
A

F

F
K

Lotto Mondays

Lotto Mondays
Tickets purchase

M

M
S

Gold

Gold
Coin

H

H
F

TOP FIVE MONEY TASKS

TOP FIVE MONEY TASKS

EARNINGS

EXPENSES

INVESTMENTS

SAVINGS

SHARING


Search This Blog

Ontario just released its 2021 Sunshine List of $100K+ earners. See it for yourself

https://www.cbc.ca/news/canada/toronto/ontario-2021-sunshine-list-1.6397437 Ontario just released its 2021 Sunshine List of $100K+ earners. ...